🌊Live Scanner and Day Trade Ideas NO DELAY. Morning Gappers Momentum and Halt Scanner 04/22/2024
Join our community of day traders as we stream our proprietary stock scanners live during PreMarket, Market Hours, and After Hours. Get realtime insights and make informed trading decisions with our stateoftheart tools.
Our advanced scanners and screeners provide realtime data without delay, giving you trade ideas and the competitive edge you need for profitable day trading.
Support our channel by tipping us: https://streamelements.com/zendoo/tip
How to Use Our Live Scanners:
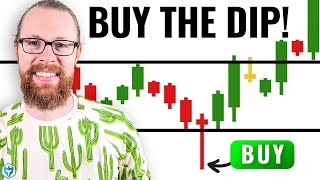
Read the frames from top to bottom the more green you see, the higher the potential for profitability.
Listen for audio cues for scanner events, so you don't have to watch the screen constantly.
Check our charts for risk management, potential halts levels, and more.
Got questions? Ask in the chat! Our beginnerfriendly community is always eager to help.
Chat Rules & Guidelines: https://tinyurl.com/4sk2erkp
How to Communicate Your Trades: https://tinyurl.com/mwdb89z5
Scanner highlights:
PreMarket: Identify stocks with high momentum probability (highest % gap, volume, positive VWAP slope, high volatility potential, small spread, and price above VWAP)
Market Hours: Find the most profitable momentum stocks, shortterm momentum opportunities, overextended stocks, and halted stocks for various trading strategies.
Audio cues:
Bell: Every 5 minutes
Female Voice: New stock is rising towards High of Day (From our Discord scanner).
Male Voice: Stock experiencing a price surge (2minute momentum) with increased volume.
Summary of Scanner Columns:
Aim for all columns to be green. When all columns are neon green, the stock has the highest potential to move higher. These are not trading advice but suggestive signals to evaluate with due diligence.
Column 1: ZenV = slope of VWAP. Green = rising, Red = falling.
Column 2: ZenP Volatility potential.
Column 3: AtrSpread Contribution of spread to volatility using ATR.
Column 4: AtrToVwap Distance to VWAP in ATR units. Green = above VWAP, Red = below VWAP.
Column 5: AtrToHighofDay Distance to High of Day in ATR units. Green when the distance to HoD is less than 1 ATR.
Key Terms:
ATR = Average True Range
HOD = High of Day
VWAP = Volume Weighted Average Price
LowFloat = Stocks with a small number of shares available for trading, potentially more volatile.
Become a ZenMember on Discord: / discord
Upgrade your experience by joining our Discord server as a ZenMember. Gain access to exclusive scanners, tools, and a supportive trading community.
Comparison: Free YouTube vs. ZenMember Subscription (Discord): https://tinyurl.com/44p5pswf
Hashtags:
#daytrading #stockmarket #trading #stocktrading #daytrade #tradeideas #learntotrade #livescanner #Stocks #daytradinglive
⚠ DISCLAIMER:
Our content is for entertainment purposes and reflects personal opinions. Always trade what you understand, and never follow anyone's opinion blindly. Remember to conduct your due diligence before making any trading decisions. Also, be safe while crossing streets, and share a smile with others it's good for you and them!
Don't forget to like, subscribe, and hit the bell for notifications! Happy trading!


![Wolfram Physics Project: Working Session Tuesday, Aug. 4, 2020 [Empirical Physical Metamathematics]](https://i.ytimg.com/vi/VlqerIL2kl8/mqdefault.jpg)
![React Tutorial For Beginners [ReactJS] | ReactJS Course | ReactJS For Beginners | Intellipaat](https://i.ytimg.com/vi/9vZ8ELqerPo/mqdefault.jpg)