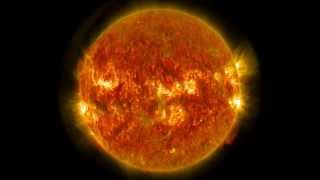
X-8.79 Solar Flare from R3664(68) and ICMEs from East and West rims 14 May 2024 4K

I am a United States Army Veteran who worked in the NSA. I now use my analytical expertise to study science. I focus on things I can scientifically prove with data. All questions are welcome.
Thank you to USGS for providing the Swarm software, and IRIS for providing the data.
Live Chat Commands Available: !Descrition, !HVO, !CVO, !AVO, !YVO, !Weather, !kindex, !xray, !proton, !jokes, !morejokes and !rules
Show the Earth that you care. 1 USD plants a tree: • Using Drones to Plant 20,000,000 Trees
►Recent News and Updates:
Trusted Kilauea, Hawaii Updates: / hawaiipodd
What causes Yellowstone Earthquake Swarms: https://www.usgs.gov/centernews/what...
USGS explains How Geysers Work: https://volcanoes.usgs.gov/volcanoes/...
Solar Monitoring:
Bt/Bz (white/red lines) Bt indicates the total strength of the Interplanetary Magnetic Field (IMF) carried by the solar wind. A higher number indicates a stronger impact to earth's magnetic field. Bz indicates the orientation of the IMF. If the Bz is positive (northward), then the earth's magnetic field will block most of the solar wind, and geomagnetic storming is unlikely. But if Bz is negative (southward), then the sun and the earth's magnetic field will link up, which allows the solar wind to pour into the earth's atmosphere, causing the aurora. The further southward the Bz points and the longer the duration, the higher the chance is of a geomagnetic storm occurring.
Phi (blue line) Phi is the angle of the IMF measured in the GSM (geocentric solar magnetospheric) coordinate system. Sudden and rapid changes in the Phi angle in conjunction with increased solar wind speeds and Bz fluctuations is common during a CME impact.
Density (orange line) The solar wind carries with it plasma (electrons and protons). This is measured in atoms per cubic centimeter. A high and fluctuating plasma density is usually better at stirring up the aurora.
Speed (yellow line) Measured in kilometers per second, the speed of the solar wind can vary from 250 800+ km/s. A faster solar wind is usually associated with elevated geomagnetic activity.
Temp (green line) Measured in Kelvin units. A rise in temperature is likely during an impact to earth's magnetic field.
C2 images show the inner solar corona up to 8.4 million kilometers (5.25 million miles) away from the Sun.
C3 images have a larger field of view: They encompass 32 diameters of the Sun. To put this in perspective, the diameter of the images is 45 million kilometers (about 30 million miles) at the distance of the Sun, or half of the diameter of the orbit of Mercury. Many bright stars can be seen behind the Sun.
The MDI (Michelson Doppler Imager) images shown here are taken in the continuum near the Ni I 6768 Angstrom line. The most prominent features are the sunspots. This is very much how the Sun looks like in the visible range of the spectrum. The magnetogram image shows the magnetic field in the solar photosphere, with black and white indicating opposite polarities.
►If you wish to donate to help with the channel, for 1 USD a month you can join my Patreon here: / matthewshipley
https://www.nps.gov/yell/learn/photos...
Thanks to volunteers, this webcam provides a streaming view of Old Faithful Geyser and other happenings around the Upper Geyser Basin.
Penguins!
California Academy of Sciences
Monterey Bay Aquarium
http://ovsa.njit.edu/
https://www.nhc.noaa.gov
https://www.swpc.noaa.gov
https://earth.nullschool.net/
https://www.monolake.org/
https://www.google.com/maps/
Join me in the Kerbal Space Program Simulation Game: https://www.kerbalspaceprogram.com/ga...
The University of Michigan’s BATSRUS magnetohydrodynamic (MHD) model of the magnetosphere
Courtesy of NASA/SDO/Goddard Space Flight Center and the AIA, EVE, and HMI science teams.
SWPC images and animations from GOES SUVI instruments in nearrealtime, for analyzing and observing events.
This work utilizes SOLIS data obtained by the NSO Integrated Synoptic Program (NISP), managed by the National Solar Observatory, which is operated by the Association of Universities for Research in Astronomy (AURA), Inc. under a cooperative agreement with the National Science Foundation.
Noncommercial use of Eyes on the Solar System: NASA's Jet Propulsion Laboratory | California Institute of Technology: https://eyes.nasa.gov/eyesonthesol...
Courtesy of STEREO/[instrument] consortium.
CGI Software support provided in part through the cgic © library:
cgic, copyright 1995 by Thomas Boutell. Permission is granted to use cgic in any application, commercial or noncommercial, at no cost.
Following #SolarStorms and #CoronalMassEjections #CME and monitoring for #Earthquakes and #Volcanoes