Introduction to Statistics

This video tutorial provides a basic introduction into statistics. It explains how to find the mean, median, mode, and range of a data set. It also explains how to find the interquartile range, quartiles, percentiles as well as any outliers. It also mentions how to construct box and whisker plots, histograms, frequency tables, frequency distribution tables, dot plots, and stem and leaf plots. It also covers relative frequency and cumulative relative frequency as well as how to use it to determine the value that a corresponds to a certain percentile. Finally, this video also discusses skewness it explains which distribution is symmetric and which is skewed to the right (positive skew) and which is skewed to the left (negative skew).
Introduction to Statistics:
• Introduction to Statistics
Descriptive Vs Inferential Statistics:
• Descriptive Statistics vs Inferential...
Qualitative and Quantitative Data:
• Qualitative and Quantitative
Statistic Vs Parameter:
• Statistic vs Parameter & Population v...
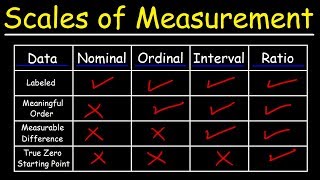
Scales of Measurement:
• Scales of Measurement Nominal, Ordi...
__________________________________
Mean, Median, Mode, & Range:
• Mean, Median, Mode, and Range How T...
Weighted Mean & Averages:
• How To Find The Weighted Mean and Wei...
Find Missing Value Given The Mean:
• How To Find The Missing Value Given T...
Excel Mean, Median, Mode, & Range:
• Calculating The Standard Deviation, M...
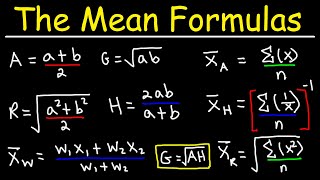
Arithmetic, Geometric, & Harmonic Mean:
• Arithmetic Mean, Geometric Mean, Weig...
___________________________________
Simple Frequency Tables:
• How To Make a Simple Frequency Table
Relative Frequency Distribution Table:
• How To Make a Relative Frequency Dist...
Cumulative Relative Frequency Table:
• How To Make a Cumulative Relative Fre...
Dot Plots and Frequency Tables:
• Dot Plots and Frequency Tables
Stem and Leaf Plots:
• Stem and Leaf Plots
____________________________________
Final Exams and Video Playlists:
https://www.videotutor.net/