Transform dashboard insights into an action-inspiring story

Dashboard interactivity makes data discovery much easier, but to drive meaningful change, it is usually more effective to craft a separate presentation specific to the story we want to tell. This video illustrates how to transform dashboard insights into an actioninspiring communication.
JUMP TO THE SECTION THAT INTERESTS YOU
00:00 Intro
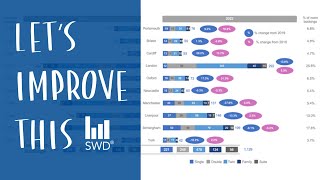
01:42 Make a dashboard easier to read
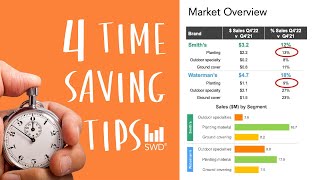
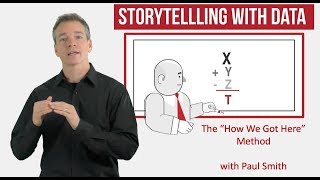
04:33 Tell a story from a dashboard
07:44 Single slide summary
08:33 Outro
BROWSE RELATED RESOURCES
● Practice transforming a dashboard into a story in this community exercise: https://community.storytellingwithdat...
● Take a peek inside of Cole's top recommended book for those making dashboards, The Big Book of Dashboards by Steve Wexler, Jeffrey Shaffer, and Andy Cotgreave: • Build your data viz library | The Big...
● Learn more about specific graph types in our chart guide: https://www.storytellingwithdata.com/...
● Read more about transitioning from a dashboard to a story in this related article: https://www.storytellingwithdata.com/...
● Explore more data to story transformations on our makeovers page: https://www.storytellingwithdata.com/...
IMPROVE YOUR DATA VISUALIZATION & STORYTELLING SKILLS
Order Cole’s new book! http://storytellingwithyou.com
Read the books: https://www.storytellingwithdata.com/...
Follow the blog: http://storytellingwithdata.com/blog
Practice in the SWD community: http://community.storytellingwithdata...
Listen to the podcast: http://storytellingwithdata.com/podcast
Attend a workshop: http://storytellingwithdata.com/works...
STAY CONNECTED
LinkedIn: / storytellingwithdatallc
Twitter: / storywithdata
Instagram: / storywithdata
Don’t forget to subscribe for new videos! http://youtube.com/c/storytellingwith...