
This must be the smartest way to find the NSE open interest - [Bubble Chart Technique]

Open interest analysis is made easy with this bubble chart technique. Must See for stock traders
About Video
This video explains the basis aspects of open interest and it breaks the common myths. This way of using open interest with bubble chart is simply awesome. The price, open interest and trading volume are presented smartly to take reliable decision using the bubble chat technique.
This video covers the basics of open interest with a simple illustration. It also describes the relationship between the price and open interest. Most interestingly here you can find why the intraday open interest is so irrelevant for Indian Markets. At last you can find the smart charting tool which can helps you to locate good stock for trading.
Why volume and open interest are different?
There is always a misapprehension of open interest with trading volume. The changes in the volume do not necessarily affect the number of open interest. Hence the first section of video mainly focuses on fundamental concepts of open interest with illustration. There you can find how the open interest change from trade to trade.
What is Open Interest?
Open interest generally refers to the eminent number of outstanding contracts (futures / option) in any given day. For every buyer in the market there should be necessarily a seller to complete a contract. Hence open interest equals the number of buyers and the number of sellers exists in the market but not combined.
Why Open Interest?
Open interest also acts an indicator for analysing the existing trend. Open interest acts as a measure of the trader’s interest in a contract. Increasing open interest new trader coming into the market, while decreasing open interest indicates traders are exiting out of the market.
Where to find the open interest?
NSE derivative traders can find the actual data End of the data at NSE official website www.nseindia.com
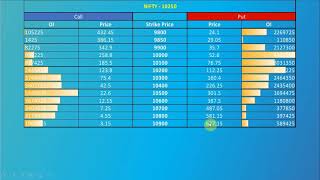
We believe bubble chart is the interesting ways to present the open interest analysis to smartly take decision. To know more about using the bubble chart technique watch the complete video.
EQSIS bubble chart for Open interest https://www.eqsis.com/nsestockprice...
EQSIS table for open interest analysis https://www.eqsis.com/nsederivative...
Other related videos:
Kindly subscribe our YouTube channel to get alerts on our upcoming videos. Remember to Press Bell symbol to enable notification.
Our YouTube Channel link: / eqsis
This video explains how to track FII buying and selling activities using open interest analysis. • How to trade using open interest
Token of appreciation:
We feel great if you can share this video in your preferred social network (Facebook, twitter, LinkedIn and WhatsApp)
I thank the viewers who subscribe this video and supported our immense efforts by endorsing our research. I request the readers to watch the complete video with patience and without fast forwarding.


![HandsOn Power BI Tutorial Beginner to Pro 2023 Edition [Full Course] ⚡](https://i.ytimg.com/vi/77jIzgvCIYY/mqdefault.jpg)
![Kubernetes Tutorial for Beginners [FULL COURSE in 4 Hours]](https://i.ytimg.com/vi/X48VuDVv0do/mqdefault.jpg)


![Power BI Dataflows Tutorial and Best Practices [Full Course]](https://i.ytimg.com/vi/GuU6_cqu8FE/mqdefault.jpg)
![3 ways an option writer makes money [With Example] EQSIS](https://i.ytimg.com/vi/mDKEE74FNKs/mqdefault.jpg)


![How to calculate stoploss for option selling? #With Example [Quiz Included ]](https://i.ytimg.com/vi/fEHjVDQsB1I/mqdefault.jpg)

![⌛ Option Chain Analysis Explained Using Filters and Charts [With Live Examples] EQSIS](https://i.ytimg.com/vi/ApBzucw-mTs/mqdefault.jpg)

![PySpark Full Course [2024] | Learn PySpark | PySpark Tutorial | Edureka](https://i.ytimg.com/vi/sSkAuTqfBA8/mqdefault.jpg)


