Tableau Tutorial For Beginners | Part 1 | Tableau Tutorial Part - 1 | Tableau Training | Simplilearn

Post Graduate Program In Data Analytics: https://www.simplilearn.com/pgpdata...
IIT Kanpur Professional Certificate Course In Data Analytics (India Only): https://www.simplilearn.com/iitkprof...
Caltech Data Analytics Bootcamp(US Only): https://www.simplilearn.com/dataanal...
Data Analyst Masters Program (Discount Code YTBE15): https://www.simplilearn.com/dataanal...
This Tableau Tutorial For Beginners video will help you understand what is business intelligence why we need business intelligence, what are the various business intelligence tools, what is Tableau, why Tableau, how to install Tableau, and along with that you will also see how to get started with Tableau and it features such as worksheets, dashboards, hierarchy, calculated fields, parameters, sets, and charts.
Tableau Training For Beginners Part 2: • Tableau Training For Beginners Part ...
Below topics are explained in this Tableau training for beginners video:
00:00 Introduction to Tableau Tutorial For Beginners
1. Business intelligence ( 00:53 ) Tableau Tutorial For Beginners
Why BI? ( 01:04 )
BI tools ( 01:37 )
2. Tableau ( 01:53 ) Tableau Tutorial For Beginners
Why Tableau? ( 01:57 )
Tableau installation 05:54
3. Getting started 06:55 Tableau Tutorial For Beginners
Connecting to data 06:58
Tableau workspace 09:06
4. Worksheets & dashboards 10:10 Tableau Tutorial For Beginners
Asking questions using visualizations 11:20
Hierarchy & drill down 31:04
Calculated fields 40:13
Parameters & sets 49:50
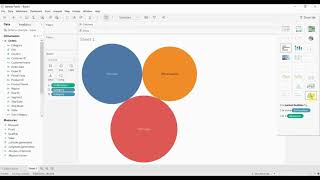
Donut chart & 2d pie chart 01:01:22
Explore our FREE Courses: https://www.simplilearn.com/skillupf...
Dataset Link https://drive.google.com/drive/folder...
✅Subscribe to our Channel to learn more about the top Technologies: https://bit.ly/2VT4WtH
⏩ Check out the Data Analytics tutorial videos: • Data Analytics | Data Analytics Full...
#tableaututorial #tableaucertification #tableaudataanalysis #tableauvisualization #tableau #tableautraining #tableaututorial #simplilearn #tableauTutorialForBeginners
What is Tableau?
Tableau is an interactive data visualization tool focused on business intelligence. It helps in simplifying the job of representing the raw data in the form of easily understandable and interactive graphs and charts. Tableau enables connectivity with a wide range of data sources like cloud, CSV files, databases, and much more.
Why learn Tableau?
Everything we do is increasingly contributing to huge amounts of data which can be leveraged by organizations to increase their business. Organizations across the world make use of Tableau to analyze this huge amount of data and derive actionable insights from it. Tableau can help you to create complex and beautiful data visualizations. With its intuitive and userfriendly approach to data visualization, Tableau is today, a popular choice for big and small organizations.
➡ About Post Graduate Program In Data Analytics
This Data Analytics Program is ideal for all working professionals and prior programming knowledge is not required. It covers topics like data analysis, data visualization, regression techniques, and supervised learning indepth via our applied learning model with live sessions by leading practitioners and industry projects.
✅ Key Features
Post Graduate Program certificate and Alumni Association membership
Exclusive hackathons and Ask me Anything sessions by IBM
8X higher live interaction in live online classes by industry experts
Capstone from 3 domains and 14+ Data Analytics Projects with Industry datasets from Google PlayStore, Lyft, World Bank etc.
Master Classes delivered by Purdue faculty and IBM experts
Simplilearn's JobAssist helps you get noticed by top hiring companies
Resume preparation and LinkedIn profile building
1:1 mock interview
Career accelerator webinars
✅ Skills Covered
Data Analytics
Statistical Analysis using Excel
Data Analysis Python and R
Data Visualization Tableau and Power BI
Linear and logistic regression modules
Clustering using kmeans
Supervised Learning
Learn More at: https://www.simplilearn.com/pgpdata...
Interested in Attending Live Classes? Call Us: IN 18002127688 / US +18445327688


![PySpark Full Course [2024] | Learn PySpark | PySpark Tutorial | Edureka](https://i.ytimg.com/vi/sSkAuTqfBA8/mqdefault.jpg)

![Power BI Dataflows Tutorial and Best Practices [Full Course]](https://i.ytimg.com/vi/GuU6_cqu8FE/mqdefault.jpg)

![Excel to Power BI [Full Course]](https://i.ytimg.com/vi/gjnnqsdvAc0/mqdefault.jpg)