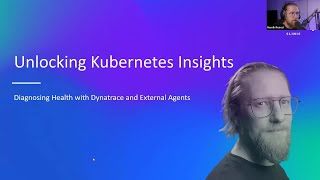
Kubernetes Observability for SREs with Dynatrace
The cloudnative community provides a constant stream of amazing new projects enabling new ways to leverage k8s for our current and future workloads. When it comes to observability, SREs and DevOps can leverage:
Prometheus to collect metrics
Fluentbit to collect logs
Event exporter to get the events from Kubernetes
Jaeger and OpenTelemetry to collect distributed traces
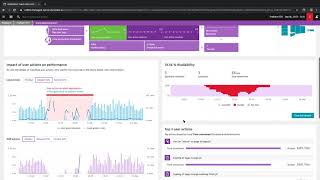
Dynatrace is keeping pace with the observability and automation demands of DevOps and SRE by leveraging the latest k8s APIs to ingest and analyze all pillars of modern observability: logs, metrics, traces, events, and more …
In this Performance Clinic Henrik Rexed, Cloud Native Advocate at Dynatrace, explains how Dynatrace:
Collects natively metrics, logs, and traces from your cluster
Ingests metrics from opensource products like Fluentbit, OpenTelemetry, and Prometheus
Enables you to manage your SLO based on metrics coming from k8s events or logs
![Kubernetes Crash Course for Absolute Beginners [NEW]](https://i.ytimg.com/vi/s_o8dwzRlu4/mqdefault.jpg)