How to understand Risk and Return of any managed portfolio

How to understand Risk and Return of any managed portfolio
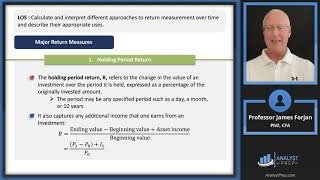
The mean return of a portfolio, also known as the expected return or average return, is a measure of the anticipated gain or loss from an investment over a specified period. It's typically calculated as the weighted average of the individual returns of the assets held in the portfolio.
Keep in mind that the mean return is an expectation and doesn't guarantee actual future performance, as investments can fluctuate in value. It's a useful metric for comparing different portfolios or evaluating the historical performance of a portfolio.
The standard deviation of a portfolio is a measure of the dispersion or variability of the returns of the portfolio around its mean return. It quantifies the risk associated with the portfolio's returns, providing an indication of how much the returns typically deviate from the average return.
The standard deviation gives you a sense of the portfolio's risk; higher standard deviation implies higher volatility and vice versa. It's important to consider both the mean return and standard deviation together to evaluate the riskreturn tradeoff of a portfolio effectively.
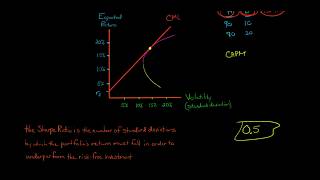
The Sharpe ratio is a measure used to evaluate the riskadjusted return of an investment or a portfolio. It helps investors understand the return they receive for the amount of risk they take. A higher Sharpe ratio indicates a better riskadjusted performance.
It's important to note that the Sharpe ratio is just one metric among many used in portfolio analysis, and investors should consider other factors such as investment objectives, time horizon, and risk tolerance when making investment decisions.
The Sortino ratio is another measure of riskadjusted return, similar to the Sharpe ratio, but it focuses specifically on downside risk. It considers only the volatility of negative returns, which are seen as undesirable by most investors. The Sortino ratio helps assess how well an investment or portfolio performs relative to the downside risk it incurs.
The key difference between the Sortino ratio and the Sharpe ratio is that the Sortino ratio focuses only on downside risk, while the Sharpe ratio considers overall volatility (both upside and downside). This makes the Sortino ratio particularly useful for investors who are more concerned about minimizing losses and managing downside risk.
Keep in mind that beta is a historical measure and reflects past relationships between the portfolio and the market. It can help investors understand how a portfolio has behaved relative to the market in the past, but it doesn't predict future performance. Investors often use beta along with other metrics to assess risk and make informed investment decisions.
Alpha is a measure of a portfolio's performance relative to its expected return based on its beta and the riskfree rate of return. It represents the excess return earned by the portfolio after adjusting for its systematic risk (as measured by beta) and the riskfree rate. A positive alpha indicates that the portfolio has outperformed its expected return, while a negative alpha suggests underperformance.
Beta is a measure of a portfolio's sensitivity to market movements, specifically to the movements of a benchmark index such as the S&P 500. It quantifies the degree of systematic risk or volatility of a portfolio in relation to the overall market.
Calculating alpha requires historical return data for the portfolio, the market index used for beta calculation, and the riskfree rate over the same period. Alpha is a valuable metric for evaluating the skill or performance of a portfolio manager or investment strategy, as it considers riskadjusted returns beyond simply comparing to a benchmark index.