27 Storms: Arlene to Zeta

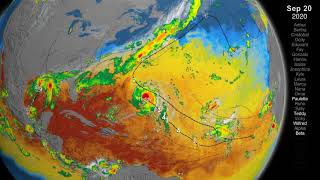
Many records were broken during the 2005 Atlantic hurricane season including: the most hurricanes ever, the most category 5 hurricanes, and the most intense hurricane ever recorded in the Atlantic as measured by atmospheric pressure. This visualization shows all 27 named storms that formed during the 2005 Atlantic hurricane season and examines some of the conditions that made hurricane formation so favorable.
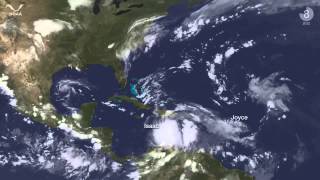
The visualization begins by showing the regions of warm water that are favorable for storm development advancing northward through the peak of hurricane season and then receding as the waters cool. The thermal energy in these warm waters powers the hurricanes. Strong shearing winds in the troposphere can disrupt developing young storms, but measurements indicate that there was very little shearing wind activity in 2005 to impede storm formation.
Sea surface temperatures, clouds, storm tracks, and hurricane category labels are shown as the hurricane season progresses.
This visualization shows some of the actual data that NASA and NOAA satellites measured in 2005 — data used to predict the paths and intensities of hurricanes. Satellite data play a vital role in helping us understand the land, ocean, and atmosphere systems that have such dramatic effects on our lives.
NOTE: This visualization shows the named storms from the 2005 hurricane season. During a reanalysis of 2005, NOAA's Tropical Prediction Center/National Hurricane Center determined that a shortlived subtropcial storm developed near the Azores Islands in late September, increasing the 2005 tropical storm count from 27 to 28. This storm was not named and is not shown in this visualization.
'27 Storms: Arlene to Zeta' was shown in the SIGGRAPH 2007 Computer Animation Festival in August 2007. It was also a finalist in the 2006 NSF Science and Engineering Visualization Challenge.
Visualizers: Greg Shirah (lead), Alex Kekesi, Lori Perkins, Horace Mitchell, Stuart A. Snodgrass, Marte Newcombe, Randall Jones, Jeff De La Beaujardiere, Eric Sokolowsky, Cindy Starr, James W. Williams, Jesse Allen, Tom Bridgman
For more information or to download this public domain video, go to https://svs.gsfc.nasa.gov/3354#7673


![Complete 2008 Hurricane Season [720p]](https://i.ytimg.com/vi/0VD-IBpvGLU/mqdefault.jpg)